Understanding the MOS Score
After completing an acoustic measurement, BMR gives you a MOS score for your room. Here is what it means, and what it is based on.
The MOS score now includes a Background Noise (Speech-to-Noise Ratio) penalty, on top of the existing Reverberation Time base and Bass Ratio penalty. This is the newest MOS variant, labelled RT-BR-N. Spatial Concentration and Flutter Echo are measured today but do not yet contribute. This page tracks the current state.
To get a MOS score that includes the background-noise penalty, take the measurement with the latest version of BMR Mobile. Measurements taken with older versions keep their original variant (RT or RT-BR) and remain fully valid — see The MOS variants below.
What is a MOS score?
MOS stands for Mean Opinion Score. It is a rating up to 5 — the higher the better — that describes how comfortable a room feels to communicate in.
| Range | Label | What it means |
|---|---|---|
| 4.6 – 5.0 | Excellent | Effortless to follow conversation |
| 3.6 – 4.5 | Good | Easy to communicate, minor fatigue over time |
| 3.0 – 3.5 | Fair | Understandable, but requires noticeable effort |
| 0 – 2.9 | Poor | Hard to follow — tiring in longer meetings |
The MOS score is not just about whether you can hear what someone is saying — it is about how much mental effort it takes to follow a conversation. The score circle is shown as a complete ring, coloured by rating.
The MOS variants
The MOS calculation evolves as we fold in more acoustic factors. So that scores stay comparable, each measurement records which variant its score was calculated with. The variant is shown as a small label under the MOS score circle, in both the Library list and the acoustic measurement view.
| Variant | Factors in the score | Introduced |
|---|---|---|
| RT | Reverberation Time | Base |
| RT-BR | Reverberation Time + Bass Ratio | Release 1.2 |
| RT-BR-N | Reverberation Time + Bass Ratio + Background Noise | Release 2.0 |
- RT — the reverberation-time base only.
- RT-BR — adds the Bass Ratio penalty for boomy, bass-heavy rooms.
- RT-BR-N — adds the Background Noise (Speech-to-Noise Ratio) penalty, so a noisier room scores lower.
The background-noise penalty is applied to measurements taken with the latest version of BMR Mobile. Update the app so new measurements are scored with the RT-BR-N variant. Older measurements keep the variant they were taken with and stay comparable — the label under each score tells you exactly which factors it already includes.
Intelligibility vs. listening effort
Most meeting rooms today are good enough that speech is technically understandable. The microphones and speakers are close enough, and the volume is adjustable. So understanding the words is rarely the problem.
The real challenge is listening effort — how hard your brain has to work to process what it hears.
A reverberant, echoey room can make every word perfectly audible, yet leave participants mentally drained after an hour. This is especially relevant in hybrid meetings, where remote participants are particularly sensitive to the acoustic quality of the room.
Traditional acoustic metrics were designed for concert halls and auditoriums, where the goal was to check whether the audience could hear the speaker at all. They are less suited to evaluating the quality of a modern meeting environment. The MOS score addresses this gap.
What the score is based on
BMR's MOS score is grounded in acoustic research conducted in collaboration with the Institute of Electronic Music and Acoustics at the University of Music and Performing Arts Graz.
The research has identified several acoustic properties that together predict how effortful a room feels to communicate in. The full formula combines them as:
MOS = A_ReverberationTime + A_SpatialConcentration + A_BassRatio − A_SpeechToNoiseRatio − A_FlutterEcho
As of Release 2.0, three terms actively contribute to the score: the Reverberation Time base, the Bass Ratio penalty, and the Speech-to-Noise Ratio (background noise) penalty. The remaining terms — Spatial Concentration and Flutter Echo — are measured or computed today and shown alongside the score, but do not yet feed into it.
Reverberation Time (T60)
This is how long sound lingers in a room after it is produced — the "echo" effect you notice in an empty stairwell or a large tiled bathroom. A shorter reverberation time generally means a cleaner, more comfortable listening environment. Longer reverberation makes it harder for the brain to separate words and follow conversation.
Direct-to-Reverberant Ratio (DRR)
The DRR is BMR's measurement of the room's Spatial Concentration — the balance between the sound that reaches you directly from the speaker, versus the reflected sound bouncing off walls, ceiling, and floor. A higher ratio — more direct sound relative to reflected sound — makes speech feel clearer and less fatiguing.
From release 1.2, DRR is displayed alongside the MOS score but does not yet contribute to it. Spatial Concentration is on the roadmap for inclusion in an upcoming release.
Bass Ratio
The Bass Ratio describes the relationship between reverberation in the bass region and reverberation at the higher frequencies of the human voice. It is calculated from the reverberation times at the four lowest measured octave bands:
Bass Ratio = (T125 + T250) / (T500 + T1000)
In an ideal meeting room the T20 curve is flat across these bands, giving a Bass Ratio close to 1.0. When the bass region rises, the room sounds boomy — low-frequency energy lingers and masks speech, which increases listening effort.
| Bass Ratio | Feel | MOS impact |
|---|---|---|
| Below 0.9 | Thin, lacking warmth | Small penalty |
| 0.9 – 1.1 | Balanced — target range | No penalty |
| 1.1 – 1.3 | Slightly warm, still comfortable | Minimal penalty |
| Above 1.3 | Boomy, low-end overhangs speech | Strong penalty |
The MOS formula penalises deviation from a neutral reference of approximately 1.15. Most well-treated meeting rooms land between 0.9 and 1.1.
Speech-to-Noise Ratio
Speech-to-Noise Ratio (SpNR) compares the loudness of a typical conversation against the steady background noise in the room. That background noise can come from HVAC, projectors, computer fans, traffic, neighbouring rooms, or hallway activity.
As of Release 2.0, SpNR is folded into the MOS score as the Background Noise penalty — the RT-BR-N variant. Take the measurement with the latest version of BMR Mobile to have this penalty applied.
When the gap between speech and noise is wide, listeners pick out words effortlessly. When it shrinks, they have to lean in, ask for repeats, or zone out. The MOS score reflects that effort directly: the noisier the room relative to speech, the lower the score.
| Gap between speech and noise | What it feels like | Typical MOS impact |
|---|---|---|
| Around 30 dB or more | Very quiet — recording-studio territory | No penalty |
| Around 20 dB | Quiet office, soft HVAC | Small penalty |
| Around 15 dB | Open office, audible fan | Moderate penalty |
| Around 10 dB | Noisy HVAC, hallway noise leaking in | Strong penalty |
| Around 3 dB or below | Speech and noise nearly equal | Penalty saturates — exhausting to follow |
Why noise hurts good rooms more
This is the part worth knowing: noise penalises good rooms more than it penalises bad ones. A room with otherwise excellent reverberation and bass control can lose more than a full star to a noisy HVAC system. A mediocre room loses less to the same noise — there is less distance left to fall.
In practice this means treating a room acoustically without also addressing its background noise can leave significant MOS improvement on the table.
How BMR measures it
BMR's IEM analyzer derives SpNR from the noise captured in the brief quiet window just before the test sweep starts. The earlier calibration step is used for speaker calibration and the ambient noise chart — it does not feed SpNR directly.
The speech reference level used in the formula assumes a normal conversational level at typical meeting-room distances. Both values are combined into a single SpNR figure that feeds the MOS score as the background-noise penalty.
Because the SpNR window is short, it is very important to avoid any noise during the measurement — once the 3-2-1 countdown finishes, the room should be as quiet as possible. Sustained talking, chair movement, or a door left open in that window pulls the SpNR figure down and lowers the MOS score for the measurement.
The measurement now filters out brief peaks in the background-noise window — a single clap or a short comment is removed rather than inflating the reading — but a consistent noise throughout the window (someone talking right next to the microphone, or persistent HVAC) cannot be filtered out and will still count.
SpNR is position-dependent in the same way reverberation is. Running measurements at more than one location in the room captures variations from one corner to another. The recommended three-position flow does this automatically.
Additional Metrics: Xi20 and Xi30
BMR also measures Xi20 and Xi30 — metrics derived from the early part of the impulse response that describe how sound energy is distributed in the first critical milliseconds after it arrives. These complement T60 and DRR by capturing finer details about how the room shapes speech clarity.
All metrics — T60, DRR, Bass Ratio, SpNR, Xi20, and Xi30 — are displayed in the measurement results alongside the MOS score.
Ambient Noise Chart
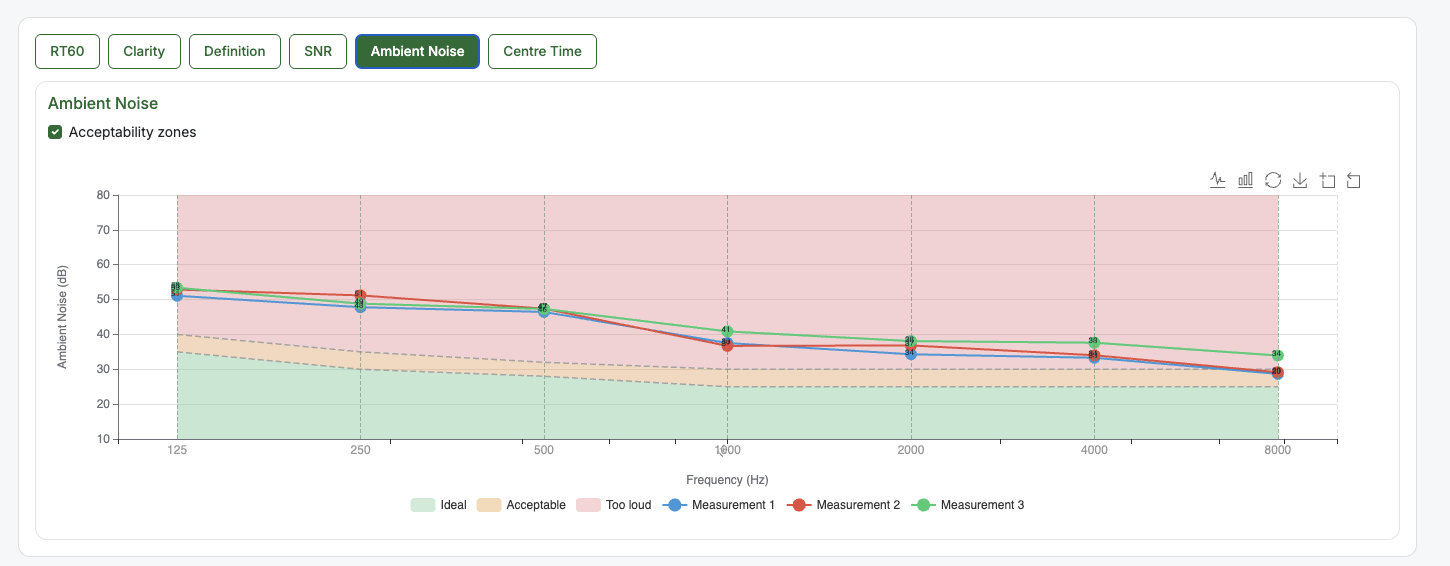
After a measurement, BMR displays an ambient noise chart showing background noise levels across frequency bands. This gives visibility into noise from HVAC, traffic, or adjacent rooms — factors that affect listening effort independently of reverberation. The chart applies to both sweep and balloon/impulse measurements.
The chart shades acceptability zones so you can read the result at a glance:
- Ideal — background noise is low enough to have no meaningful impact on speech.
- Acceptable — noise is present but within a workable range for most meetings.
- Too loud — background noise is high enough to degrade the experience and should be addressed.
Because every measurement is plotted against the same zones, you can compare background noise directly across measurements and across frequencies.
Together, these measurements capture something important: a room can feel exhausting to communicate in even when speech is technically intelligible. The MOS score reflects this perceptual reality, not just a technical threshold.
What a good score looks like
A well-designed meeting room typically targets a MOS in the Good range (3.6 or above). A Fair score (3.0 – 3.5) is still acceptable for in-person meetings, but is not recommended for hybrid use — remote participants are far more sensitive to acoustic quality and will notice the extra effort even when in-room participants do not. Rooms scoring Poor are likely causing unnecessary listening fatigue in any setting — something acoustic treatment, furniture placement, or equipment changes can often improve.
The acoustic measurement in BMR captures the data needed to calculate your room's MOS score. Running multiple measurements at different positions in the room gives a more complete picture of how the space performs overall.
For the most reliable results, run measurements at different positions — near and far from where participants typically sit. Acoustic conditions can vary significantly across a room.
The app guides you through a multi-measurement process where three measurements are bundled together. The recommended positions for the speaker and iPhone are shown before each measurement.
The Green Zone
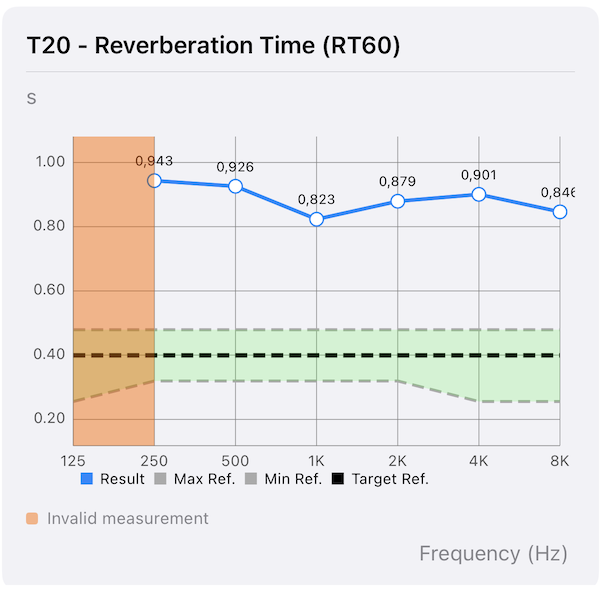
After a measurement, BMR plots the reverberation time across frequency bands as a curve. Alongside it, the app shades a Green Zone — the target band the measurement should ideally sit within for comfortable meeting-room acoustics.
The Green Zone turns an abstract number into something you can see at a glance:
- Inside the zone — the room is performing within the target for that frequency band.
- Above the zone — reverberation is too long; speech clarity suffers and listening effort rises.
- Below the zone — the room is overdamped; it can feel muffled or uncomfortably dry.
The Green Zone is what makes results comparable across rooms and across time. Two rooms with different MOS scores can be compared directly by looking at where each curve falls relative to the same target band — before treatment and after.
Only frequency bands the platform considers valid are plotted, so unreliable bands do not distract from the useful data. Any band that was excluded is shaded and labelled "Invalid measurement" rather than drawn as part of the curve — keeping the shape of the reverberation curve clean and easy to read.
The same target-band treatment now extends to the ambient noise chart, which shades Ideal / Acceptable / Too loud zones so background noise gets the same at-a-glance visual comparison.
What the score does not cover
The MOS score currently focuses on the reverberant characteristics of the physical space — reverberation time and the balance between direct and reflected sound. It does not account for:
- The quality of microphones and speakers used in the meeting setup
- Network or compression artefacts in video conferencing
Speech-to-Noise Ratio (background noise) is now included in the MOS score as of Release 2.0 — the RT-BR-N variant. Spatial Concentration and Flutter Echo are the next acoustic properties planned for inclusion; they are measured today but do not yet contribute.
Microphone and speaker quality in the meeting setup, and network or compression artefacts in video conferencing, remain outside the MOS score's scope. Those depend on the conferencing equipment and connection rather than the room.
References
- DIN 18041:2016-03, Acoustic quality in rooms.
- ÖNORM B 8115-3, Room acoustics and acoustic quality.
- ISO 3382-1:2009, Measurement of room acoustic parameters.
- ISO 60268-16:2020, Speech transmission index.
- ISO 717-1:2020, Sound insulation in buildings.
- ISO 11654:1997, Sound absorbers for use in buildings.
- ITU-T P.808:2021, Methods for objective and subjective assessment of speech and video quality.
- Schoeffler, M. et al. (2018). "webMUSHRA — A Comprehensive Framework for Web-based Listening Tests." Journal of Open Research Software, 6(1), p.8.