Reading Acoustic Results on the Web
Once an acoustic measurement is uploaded, you review it on the web platform at app.bettermeetingrooms.com. The acoustics page is designed to put the most important information first and make it easy to compare measurements.
For how the underlying numbers are calculated, see Understanding the MOS Score.
What the page shows
The acoustics page leads with the two figures that matter most, then supports them with detail:
- Overall acoustic score and average RT60 at the top — the headline read on how the room performs.
- A compact measurement list — every measurement taken in the room, so you can open, compare, and manage them.
- A Room scan & measurement positions view (beta) — see below.
The MOS score is always shown on the Room Overview too, using the linked measurement when one is set and otherwise the latest measurement. See The Room Page.
Room scan & measurement positions (beta)
The page includes a Room scan & measurement positions view that shows exactly where each part of the measurement happened, laid over the room's scan:
- The speaker position.
- Each measurement point (A, B, C) where a reading was taken.
Because BMR Mobile now pinpoints these locations during the measurement flow, you can see the spatial spread of a measurement — how far apart the points were, and where they sat relative to the speaker and the room — rather than reading numbers in isolation.
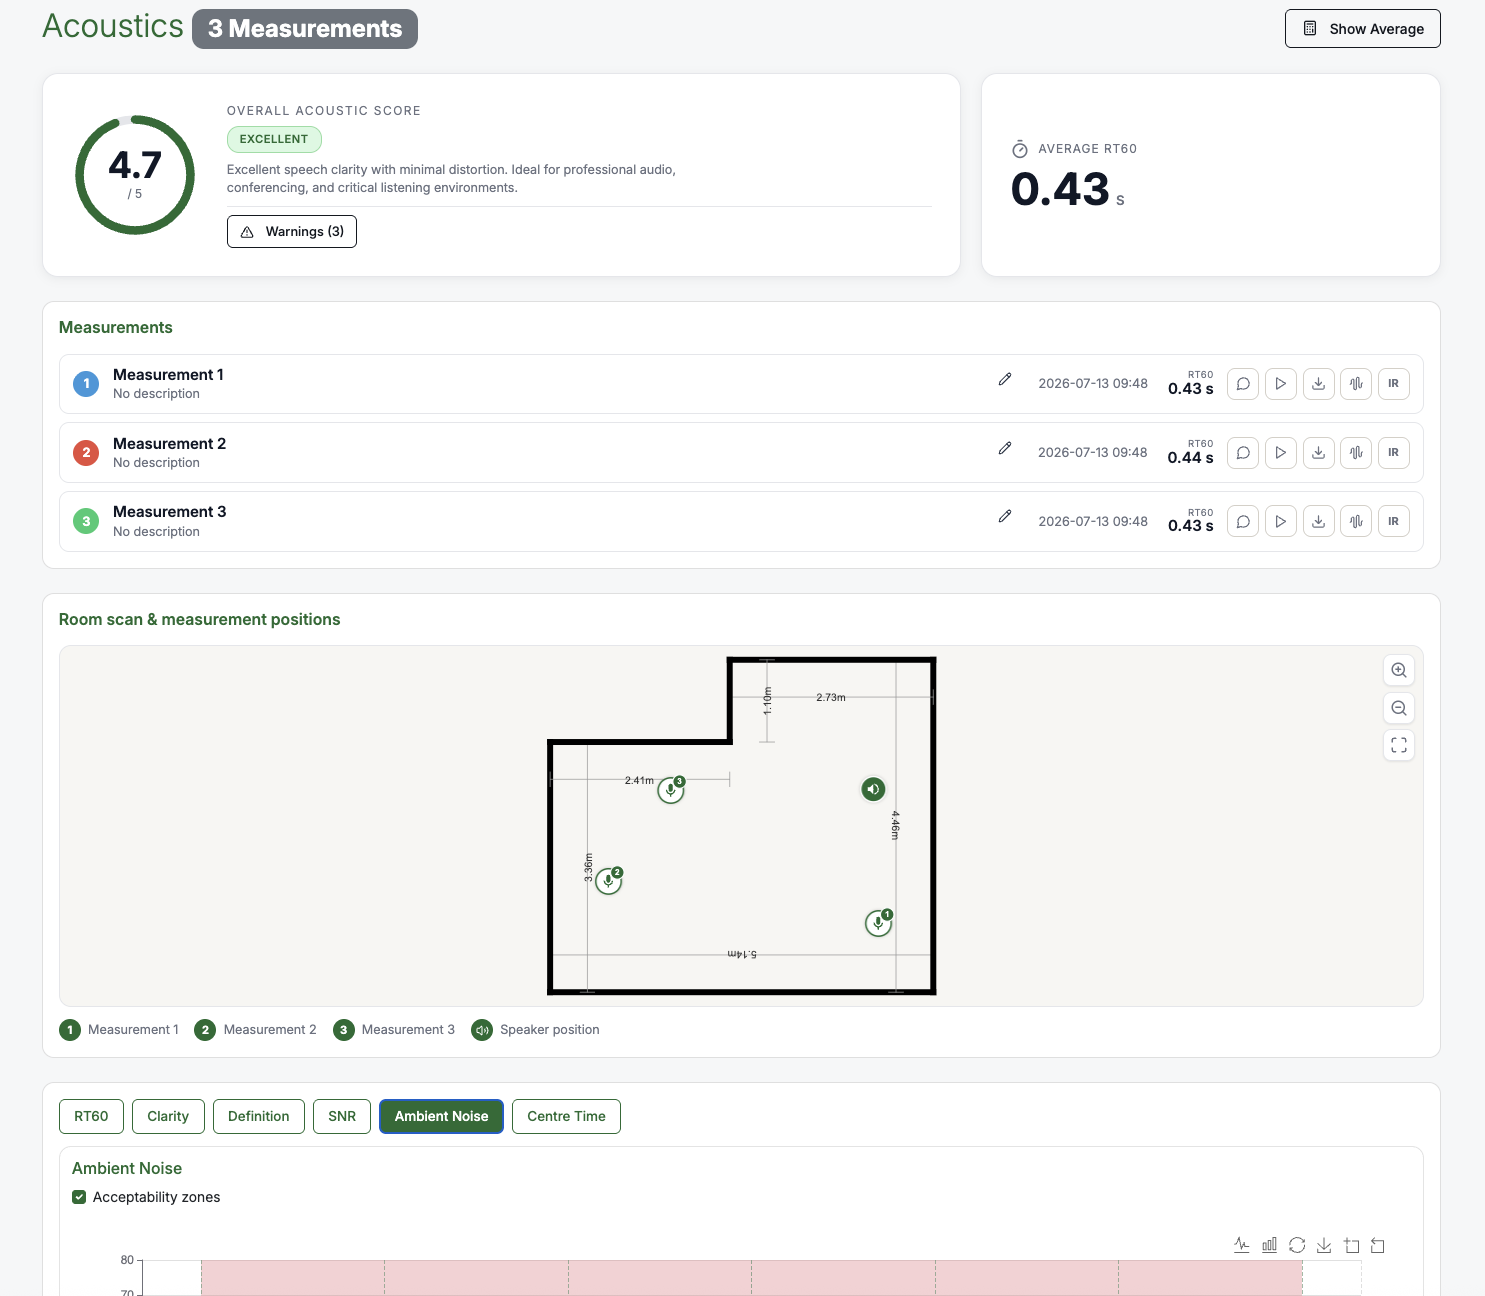
The measurement positions view is in beta. Positions are shown for measurements taken with a version of BMR Mobile that records them — older measurements may not have position data.
Supporting charts
Each measurement also surfaces the detail charts described in Understanding the MOS Score:
- The T20 (RT60) chart, plotting only the frequency bands the platform considers valid, with invalid bands shaded and labelled.
- The ambient noise chart, with Ideal / Acceptable / Too loud acceptability zones.
Related
- BMR Mobile Acoustics Tutorial — capture a measurement.
- Understanding the MOS Score — what the score and charts mean.
- The Room Page — where the room's MOS score and linked measurement appear.